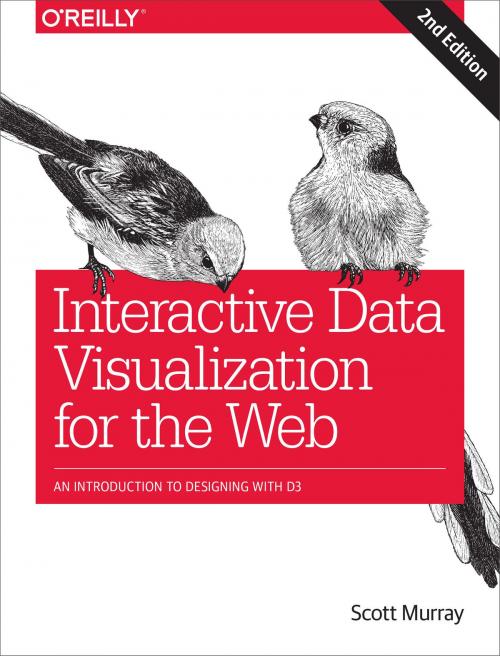
Interactive Data Visualization for the Web
An Introduction to Designing with D3
Nonfiction, Computers, General Computing, Programming| Author: | Scott Murray | ISBN: | 9781491921319 |
| Publisher: | O'Reilly Media | Publication: | August 3, 2017 |
| Imprint: | O'Reilly Media | Language: | English |
| Author: | Scott Murray |
| ISBN: | 9781491921319 |
| Publisher: | O'Reilly Media |
| Publication: | August 3, 2017 |
| Imprint: | O'Reilly Media |
| Language: | English |
Create and publish your own interactive data visualization projects on the web—even if you have little or no experience with data visualization or web development. It’s inspiring and fun with this friendly, accessible, and practical hands-on introduction. This fully updated and expanded second edition takes you through the fundamental concepts and methods of D3, the most powerful JavaScript library for expressing data visually in a web browser.
Ideal for designers with no coding experience, reporters exploring data journalism, and anyone who wants to visualize and share data, this step-by-step guide will also help you expand your web programming skills by teaching you the basics of HTML, CSS, JavaScript, and SVG.
- Learn D3 4.x—the latest D3 version—with downloadable code and over 140 examples
- Create bar charts, scatter plots, pie charts, stacked bar charts, and force-directed graphs
- Use smooth, animated transitions to show changes in your data
- Introduce interactivity to help users explore your data
- Create custom geographic maps with panning, zooming, labels, and tooltips
- Walk through the creation of a complete visualization project, from start to finish
- Explore inspiring case studies with nine accomplished designers talking about their D3-based projects


